MAEZ insight
Understanding Common Transport Safety Issues
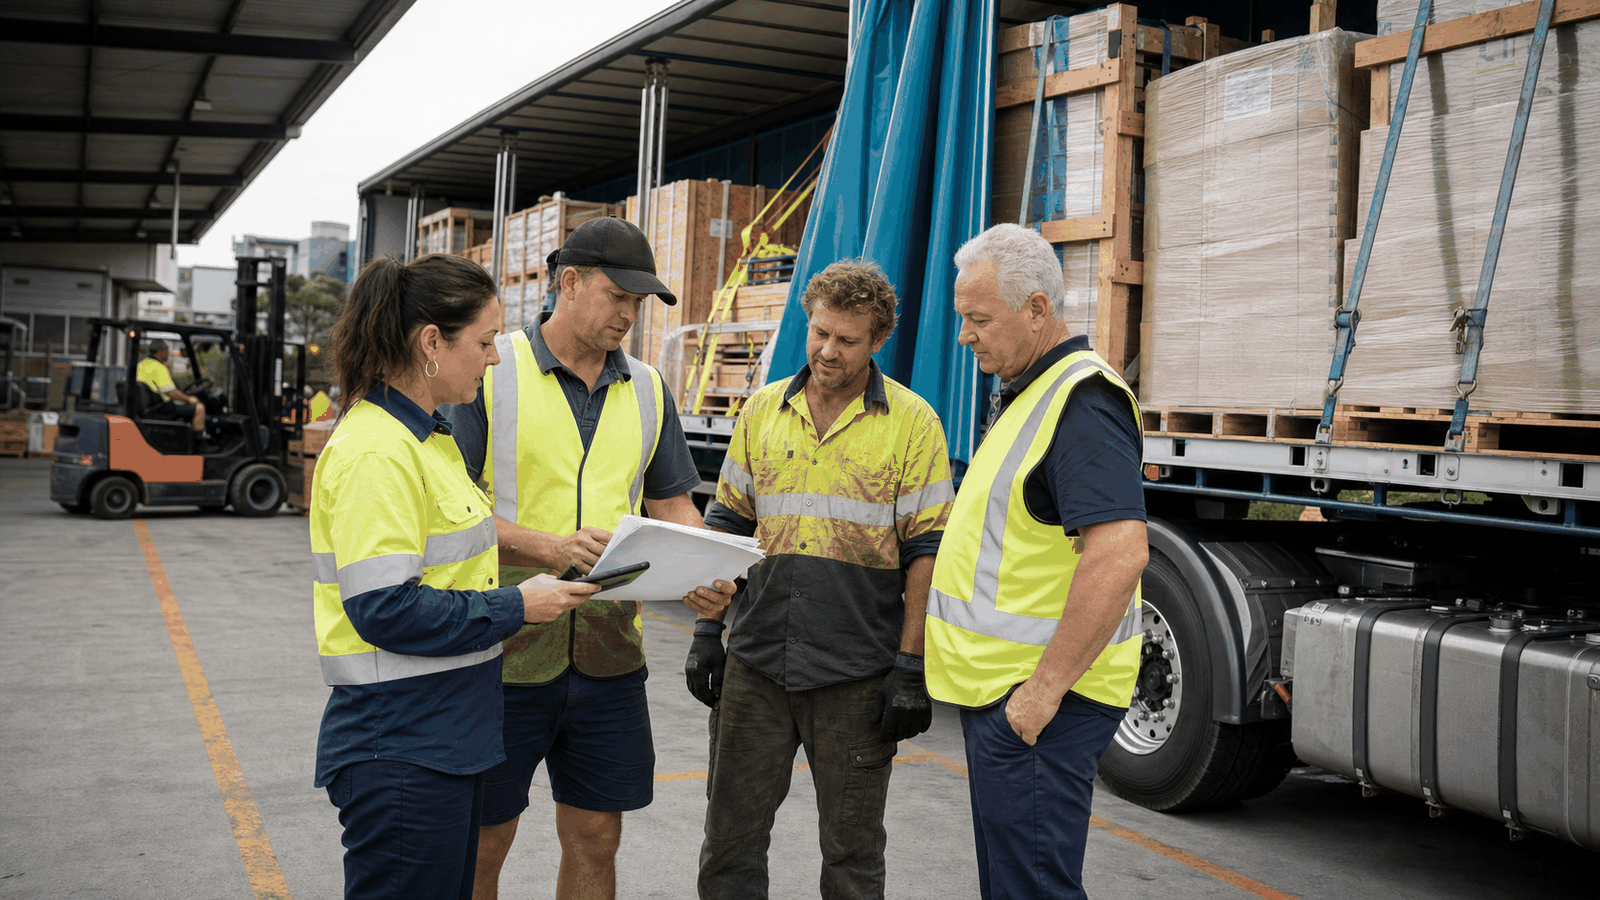
A practical guide to common transport safety issues affecting Australian drivers and fleets, including fatigue, distracted driving, collisions, and vehicle maintenance failures.

Proof that freight promises do not create unsafe transport pressure.
Loading controls need evidence, not assumptions.
Daily fleet activity has to connect back to duties, controls, and review.

Due diligence means knowing whether the safety system is actually working.
Consignors
Role-based Chain of Responsibility controls, evidence, and SMS expectations.
Consignees
Role-based Chain of Responsibility controls, evidence, and SMS expectations.
Loaders
Role-based Chain of Responsibility controls, evidence, and SMS expectations.
Managers
Role-based Chain of Responsibility controls, evidence, and SMS expectations.
What are the most common transport safety issues?
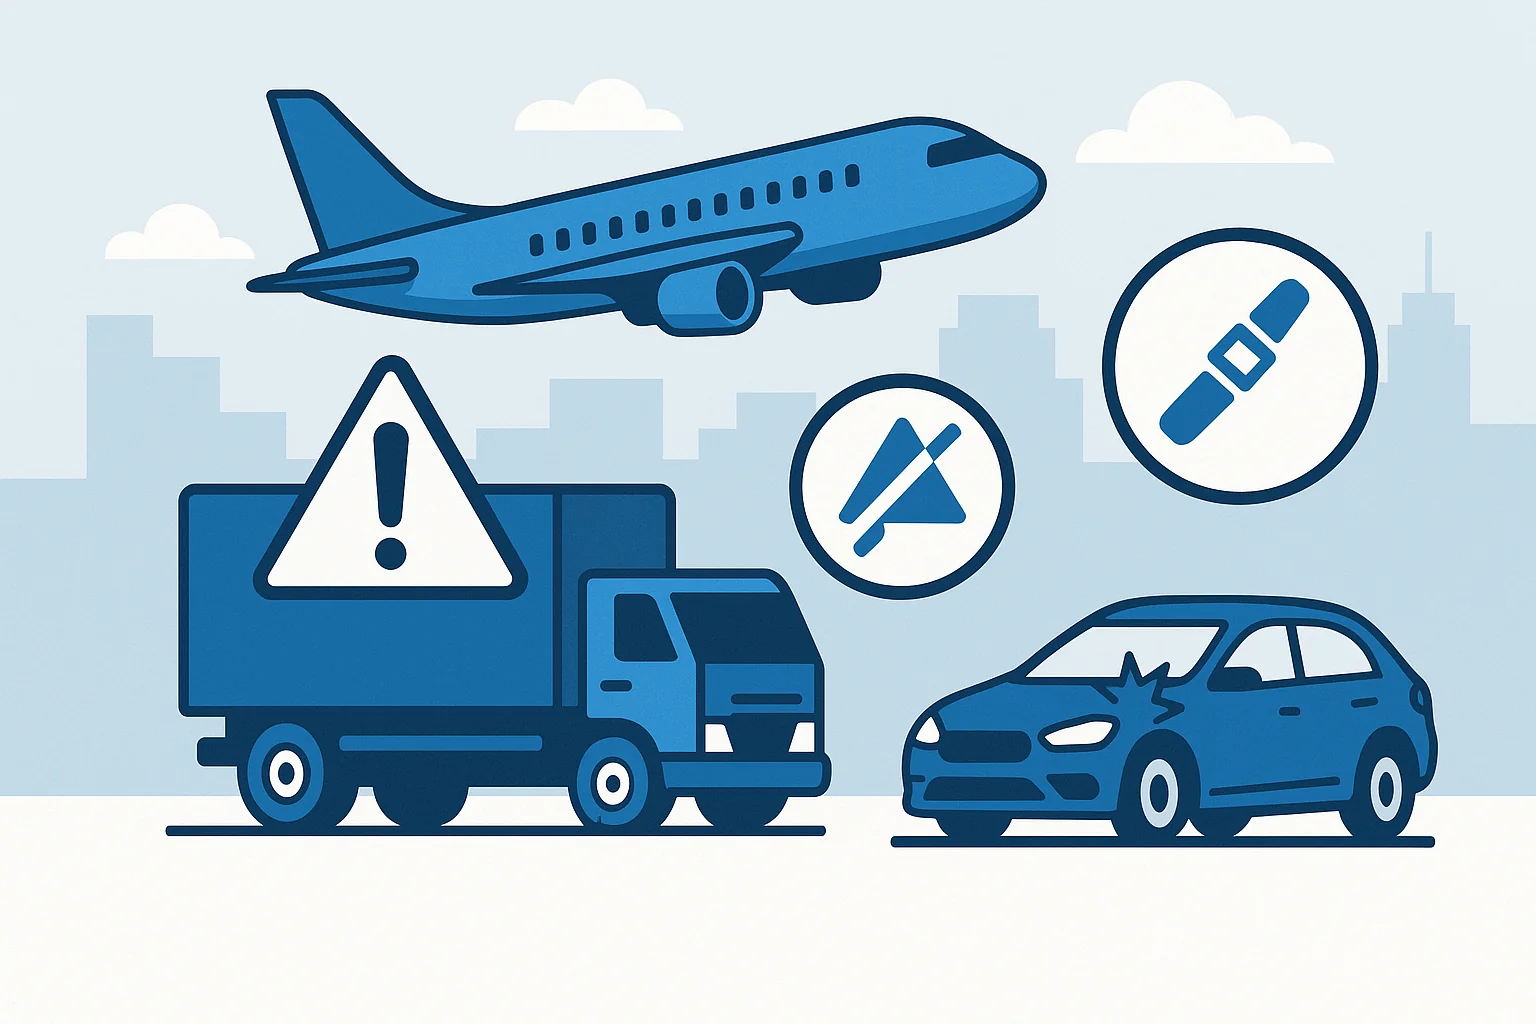
Common transport safety issues in Australia span seven categories: driver fatigue, distracted driving, vehicle collisions, poor vehicle maintenance, weather-related hazards, cargo securement failures, and slips, trips, and falls. Each issue rarely exists in isolation — poor training amplifies human error, inadequate scheduling forces rushed operations, and weak safety culture normalises risk-taking. For operators working under the Chain of Responsibility, these hazards directly intersect with the duty to ensure transport activities are safe.
Why transport safety issues matter for every operator
Seven categories of risk that connect to broader system failures
Transport safety issues affect every mode of commercial operation. Driver fatigue reduces reaction times, distracted driving accounts for thousands of crashes annually, and vehicle maintenance failures create cascading risks across entire fleets.
Each safety issue connects to broader system failures:
- Poor training amplifies human error
- Inadequate scheduling forces rushed operations
- Weak safety culture normalises risk-taking behaviour
Understanding these connections transforms how transport businesses approach risk management. The focus should be on sustainable prevention strategies that integrate into daily operations rather than reactive fixes.
Proper mitigation reduces insurance costs, protects workers, and strengthens operational reliability across supply chains.
Driver fatigue and drowsy driving
The most pervasive safety issue in transportation

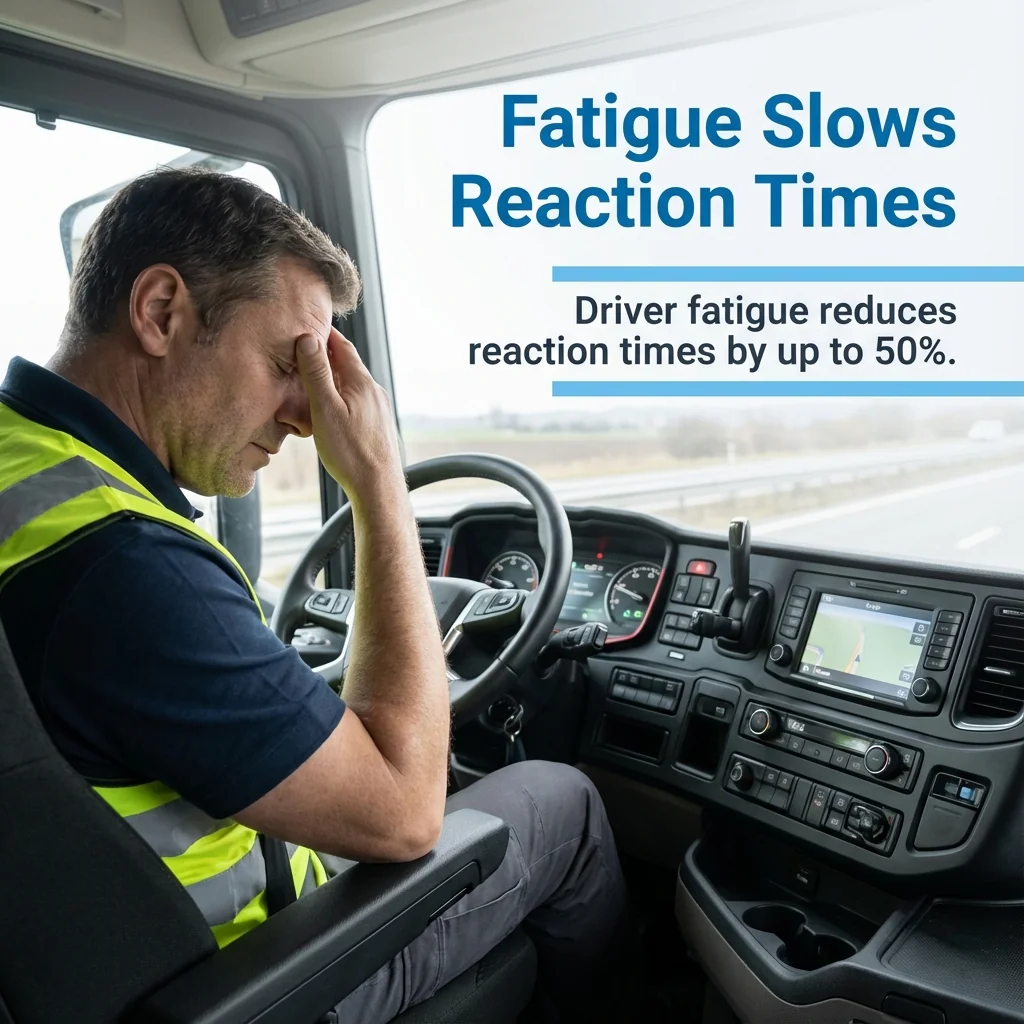
Driver fatigue represents the most pervasive safety issue in transportation. Tired drivers exhibit impaired judgement, slower reaction times, and reduced situational awareness equivalent to alcohol impairment. After 17 hours awake, performance matches someone with a 0.05% blood alcohol concentration; after 24 hours, impairment equals 0.10% BAC.
The problem extends beyond obvious drowsiness. Micro-sleeps lasting just 3–4 seconds occur without warning. At highway speeds, vehicles travel over 100 metres during these brief lapses.
Physical warning signs
- Heavy eyelids and frequent yawning
- Difficulty focusing
- Drifting between lanes
- Missed exits or slow reactions
Fatigue indicators and required action
- Frequent yawning — Moderate risk: plan a rest break within 30 minutes
- Heavy eyelids — High risk: stop immediately for a 20-minute nap
- Lane drifting — Critical risk: exit road safely and rest a minimum of 2 hours
- Missed exits — High risk: pull over at next safe location
- Difficulty focusing — Moderate risk: reduce speed and increase following distance
Regulatory frameworks attempt to control fatigue through work-hour restrictions, mandating rest breaks, daily driving limits, and weekly hour caps. Compliance requires accurate record-keeping. Effective fatigue management extends beyond regulatory minimums — leading operators implement scheduling systems that account for circadian rhythms and prioritise sleep quality over mere hours off duty.
Prevention strategies focus on sleep hygiene: consistent sleep schedules, dark quiet rest environments, and adequate off-duty recovery time. Employers must design rosters that allow proper rest. CoR training helps managers and executives understand their role in fatigue risk management.
Distracted driving and loss of awareness
Three distraction types that compound crash risk
Distracted driving diverts cognitive resources from the primary task of vehicle operation. Three distraction categories affect safety differently:
- Visual — taking eyes off the road
- Manual — removing hands from controls
- Cognitive — occupying mental attention even when eyes remain forward
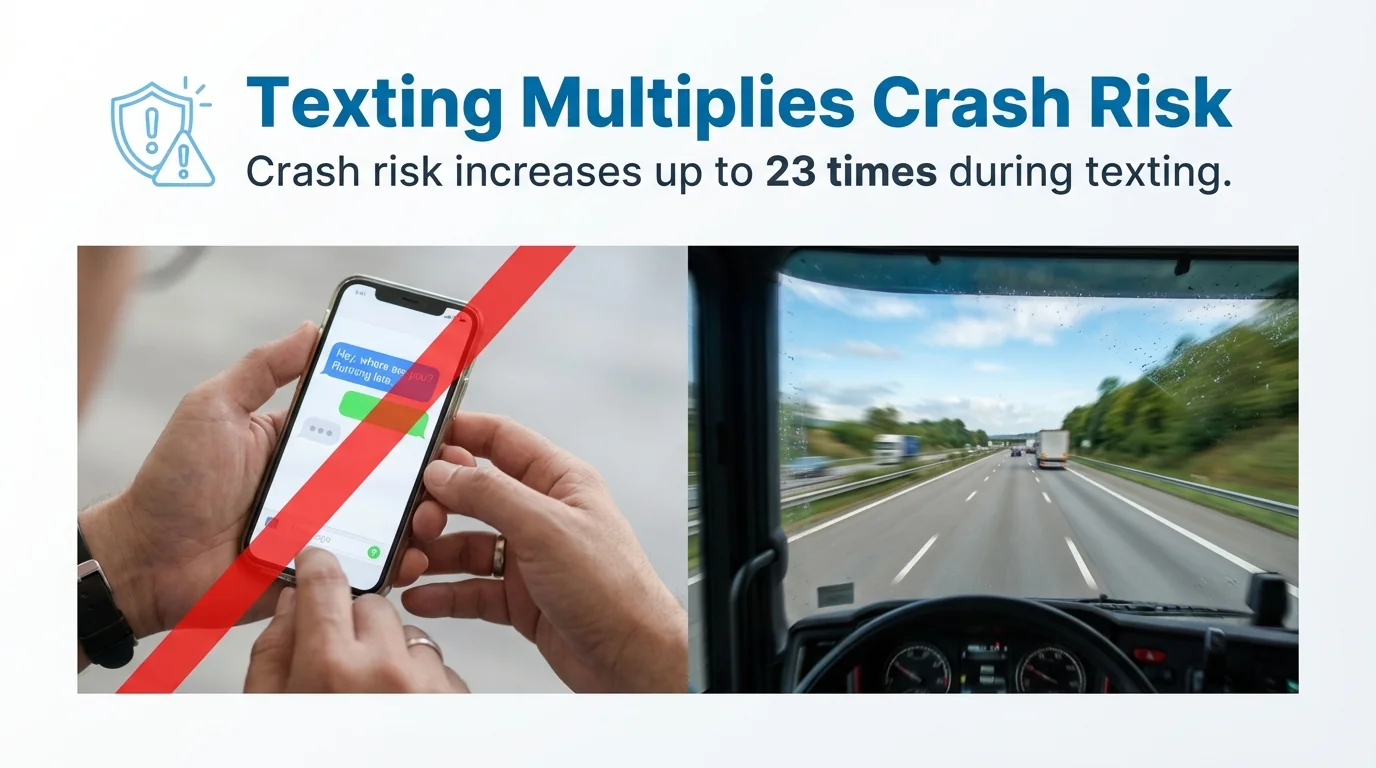
Mobile phone use while driving creates all three distraction types simultaneously. Texting while driving can increase crash risk up to 23 times, making zero-tolerance policies essential. Hands-free devices provide false security — cognitive distraction persists during phone conversations, and drivers miss critical visual cues while mentally engaged in discussions.
In-cab technology adds further complexity: GPS navigation, dispatch communications, and electronic logging devices all demand driver interaction. Work pressure generates additional dangerous distractions when drivers check delivery schedules, plan routes, or communicate with dispatch while driving.
Control measures for distraction prevention
- Establish absolute mobile phone bans during vehicle operation — no exceptions
- Use phone-blocking applications that prevent device use while moving
- Integrate dispatch communications with voice-activated interfaces
- Mount devices securely before departure
- Set climate controls and radio stations while stationary
- Plan routes before beginning trips
Driver training should emphasise hazard prediction and systematic scanning patterns to identify threats early and reduce reactive distraction. Practical training programs help embed these disciplines into daily operations.
Vehicle collisions and traffic accidents
Targeting prevention through collision mechanics
Vehicle collisions result from complex interactions between human behaviour, vehicle condition, road environment, and traffic patterns. Commercial operators face different risk profiles than passenger vehicles — heavy vehicle mass and momentum magnify damage severity in every collision type.
Common collision types and causes
- Rear-end collisions — following distances insufficient for vehicle stopping capability
- Intersection collisions — complex decision-making under time pressure; right-turn blind spots cause cyclist and pedestrian strikes
- Lane-change collisions — inadequate mirror checking and blind-spot awareness
- Loss-of-control crashes — excessive speed for conditions; vehicle rollover likely with improper loading or elevated centre of gravity
Human factors in collision causation
Aggressive driving — tailgating, rapid lane changes, and excessive speed — increases crash risk exponentially. Time-sensitive deliveries create rushing behaviour, and drivers accept smaller safety margins to maintain schedules. Organisations must design systems that prevent schedule pressure from compromising safety.
Collision prevention strategies
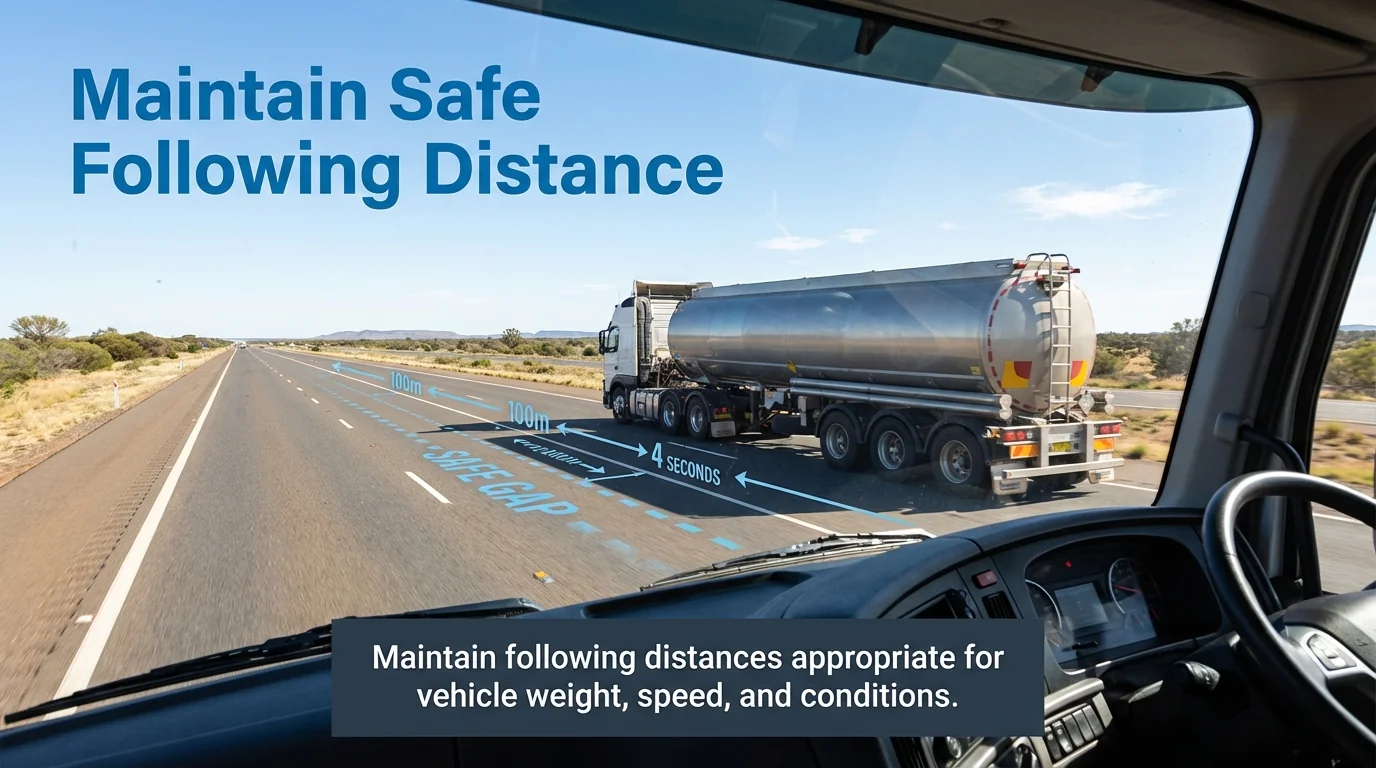
Space management forms the foundation of collision avoidance. Maintain following distances appropriate for vehicle weight, speed, and conditions — the two-second rule applies only to light vehicles in ideal conditions.
- Check mirrors every 5–8 seconds
- Scan 12–15 seconds ahead on highways
- Look for escape routes continuously
- Reduce speed 30–50% in adverse conditions
- Maintain a 4-second gap minimum for trucks
Advanced driver assistance systems provide additional protection through automatic emergency braking, lane departure warnings, and blind-spot monitoring.
Poor vehicle maintenance and equipment failure
Mechanical defects that create cascading fleet risk
Vehicle maintenance failures create safety hazards that affect both operators and other road users. Mechanical defects contribute to crashes, breakdowns, and cargo incidents across all transportation modes. The relationship between maintenance and safety operates on multiple levels — immediate failures like brake system defects cause direct incidents, while progressive deterioration gradually reduces safety margins until critical failure occurs.
Under the Heavy Vehicle National Law, operators and other parties in the transport chain have a primary duty to ensure the safety of transport activities. Vehicle standards and maintenance are a core part of meeting that duty. A CoR risk review can help identify where your maintenance evidence may fall short of what regulators expect.
Critical safety systems requiring maintenance
Brake systems demand rigorous attention — worn pads, contaminated fluid, or air system leaks compromise stopping ability. Other critical systems include steering components, suspension, tyres, lights, and coupling mechanisms.
Maintenance as a compliance and safety control
Effective maintenance programs go beyond reactive repairs. They require:
- Pre-departure checks with documented results
- Scheduled servicing aligned with manufacturer specifications
- Defect reporting and rectification tracking
- Driver-reported faults with follow-up evidence
- Maintenance records retained as compliance evidence
When maintenance is treated as a paperwork exercise rather than a safety control, defects accumulate. The result is higher breakdown rates, crash risk, and exposure to compliance breaches.
Building a safety system that addresses root causes
From individual hazards to integrated prevention
Each safety issue examined in this guide shares a common thread: they rarely exist in isolation. Fatigue interacts with scheduling pressure. Distracted driving links to workload design. Maintenance failures connect to resourcing decisions. Collisions often result from combinations of these factors.
A proper Safety Management System connects these dots. It identifies hazards, assesses risks, implements controls, and verifies that those controls actually work. The goal is to address root causes, not just symptoms.
What an integrated approach looks like
- Fatigue management built into roster design, not just work-hour compliance
- Distraction controls embedded in vehicle specification and workflow design
- Collision prevention through driver training, speed management, and technology
- Maintenance as a documented, evidenced safety control — not a paperwork exercise
For operators and executives who need to demonstrate due diligence, understanding your Chain of Responsibility obligations is the starting point. From there, practical CoR consulting can help close gaps between what your safety system says on paper and what evidence proves it actually works.
If you need help connecting these safety issues into a coherent, evidenced system, contact MAEZ for practical transport compliance advisory support.
Operational message set
Find the gaps. Fix the system. Prove the controls.
MAEZ helps transport operators deal with the compliance risk they already know is there. We help get the Safety Management System in order, protect NHVAS accreditation, reduce fine exposure, and connect training, evidence, and CoRGuard workflows where software is needed.
Find
Identify what is exposed before an auditor or regulator does.
Fix
Build the SMS controls around how the transport business actually runs.
Prove
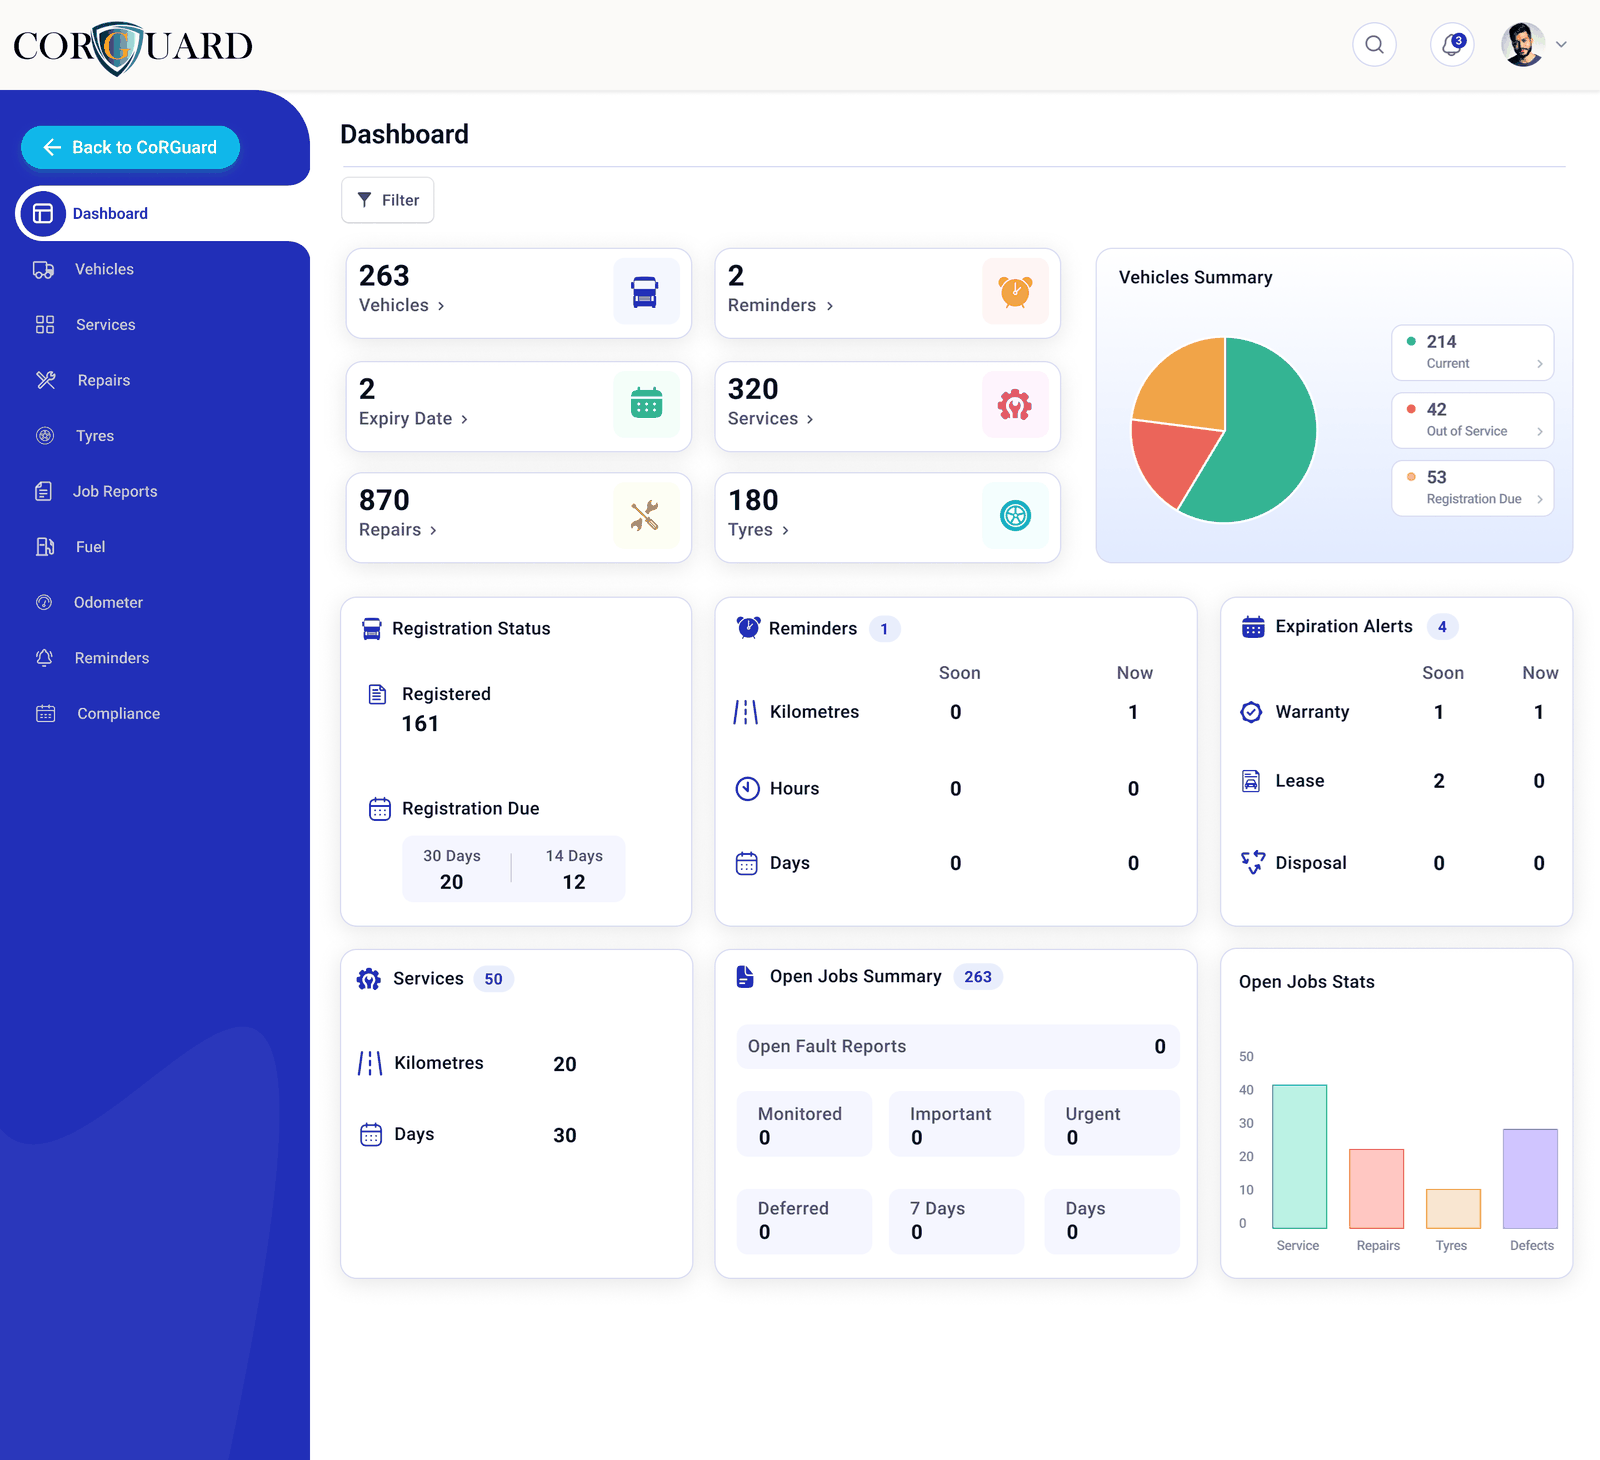
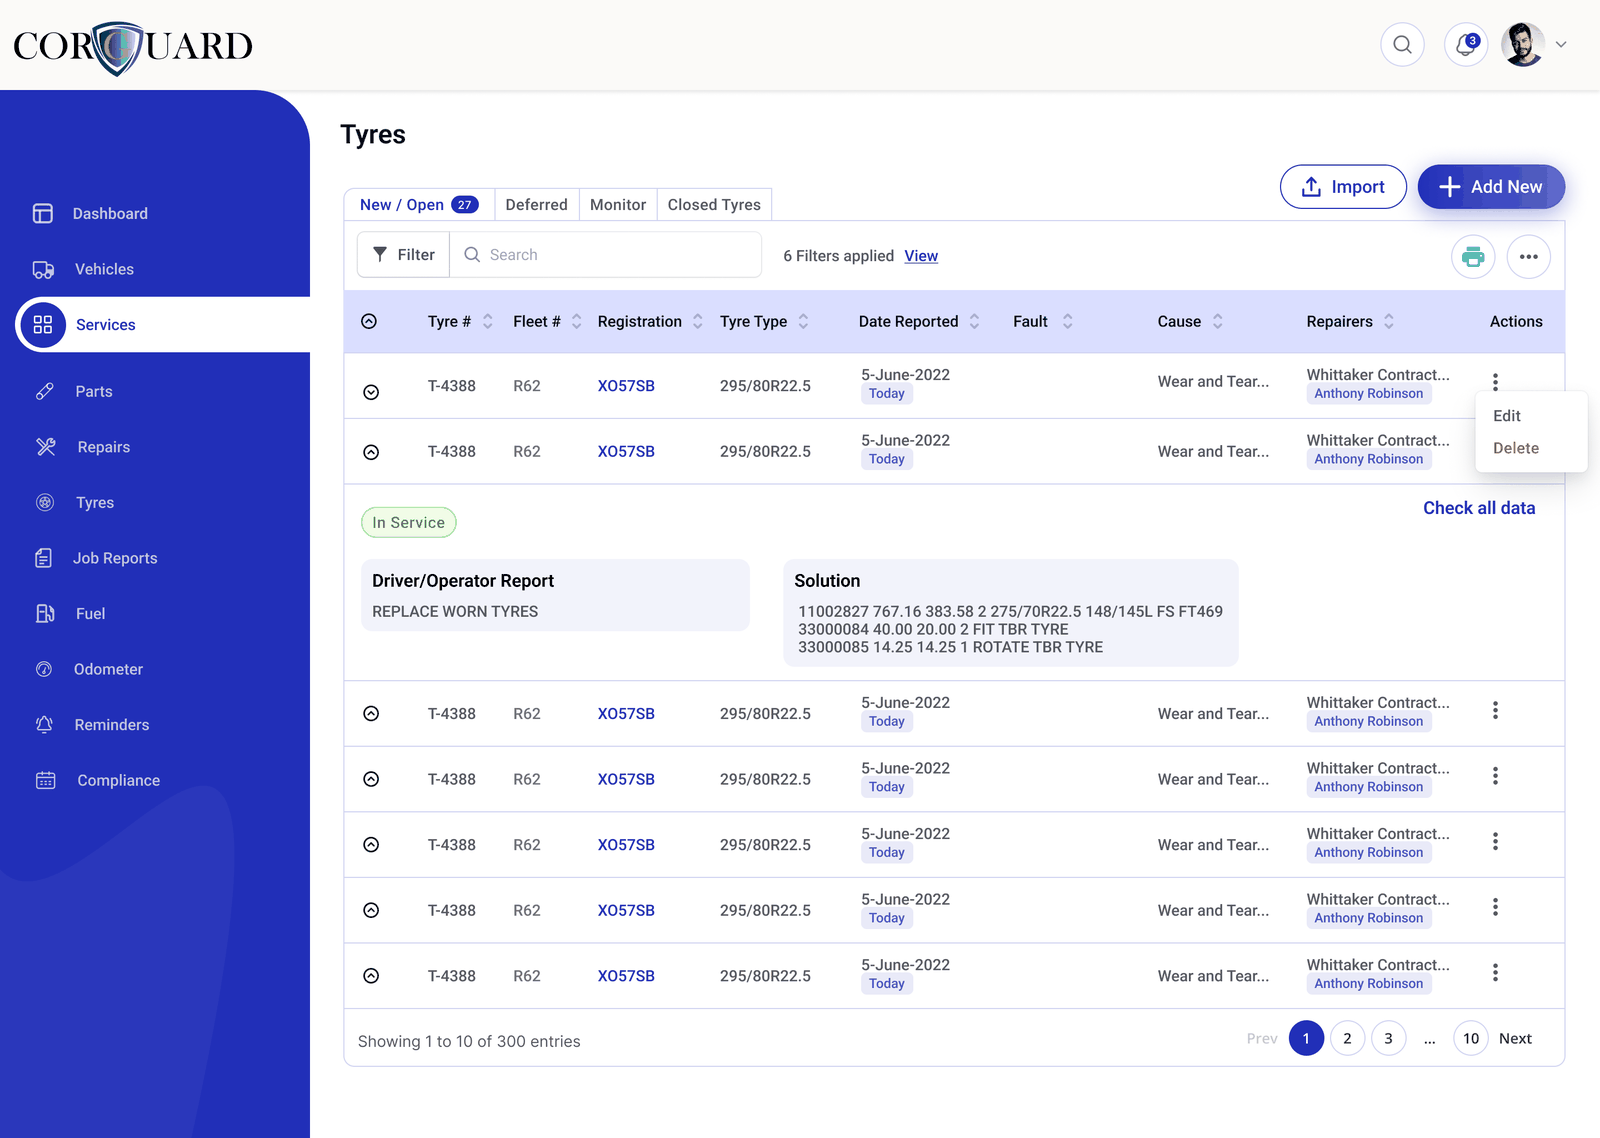
Use CoRGuard where records, reminders, diaries, audits, and evidence need structure.
Evidence path
From MAEZ advice to a working Safety Management System
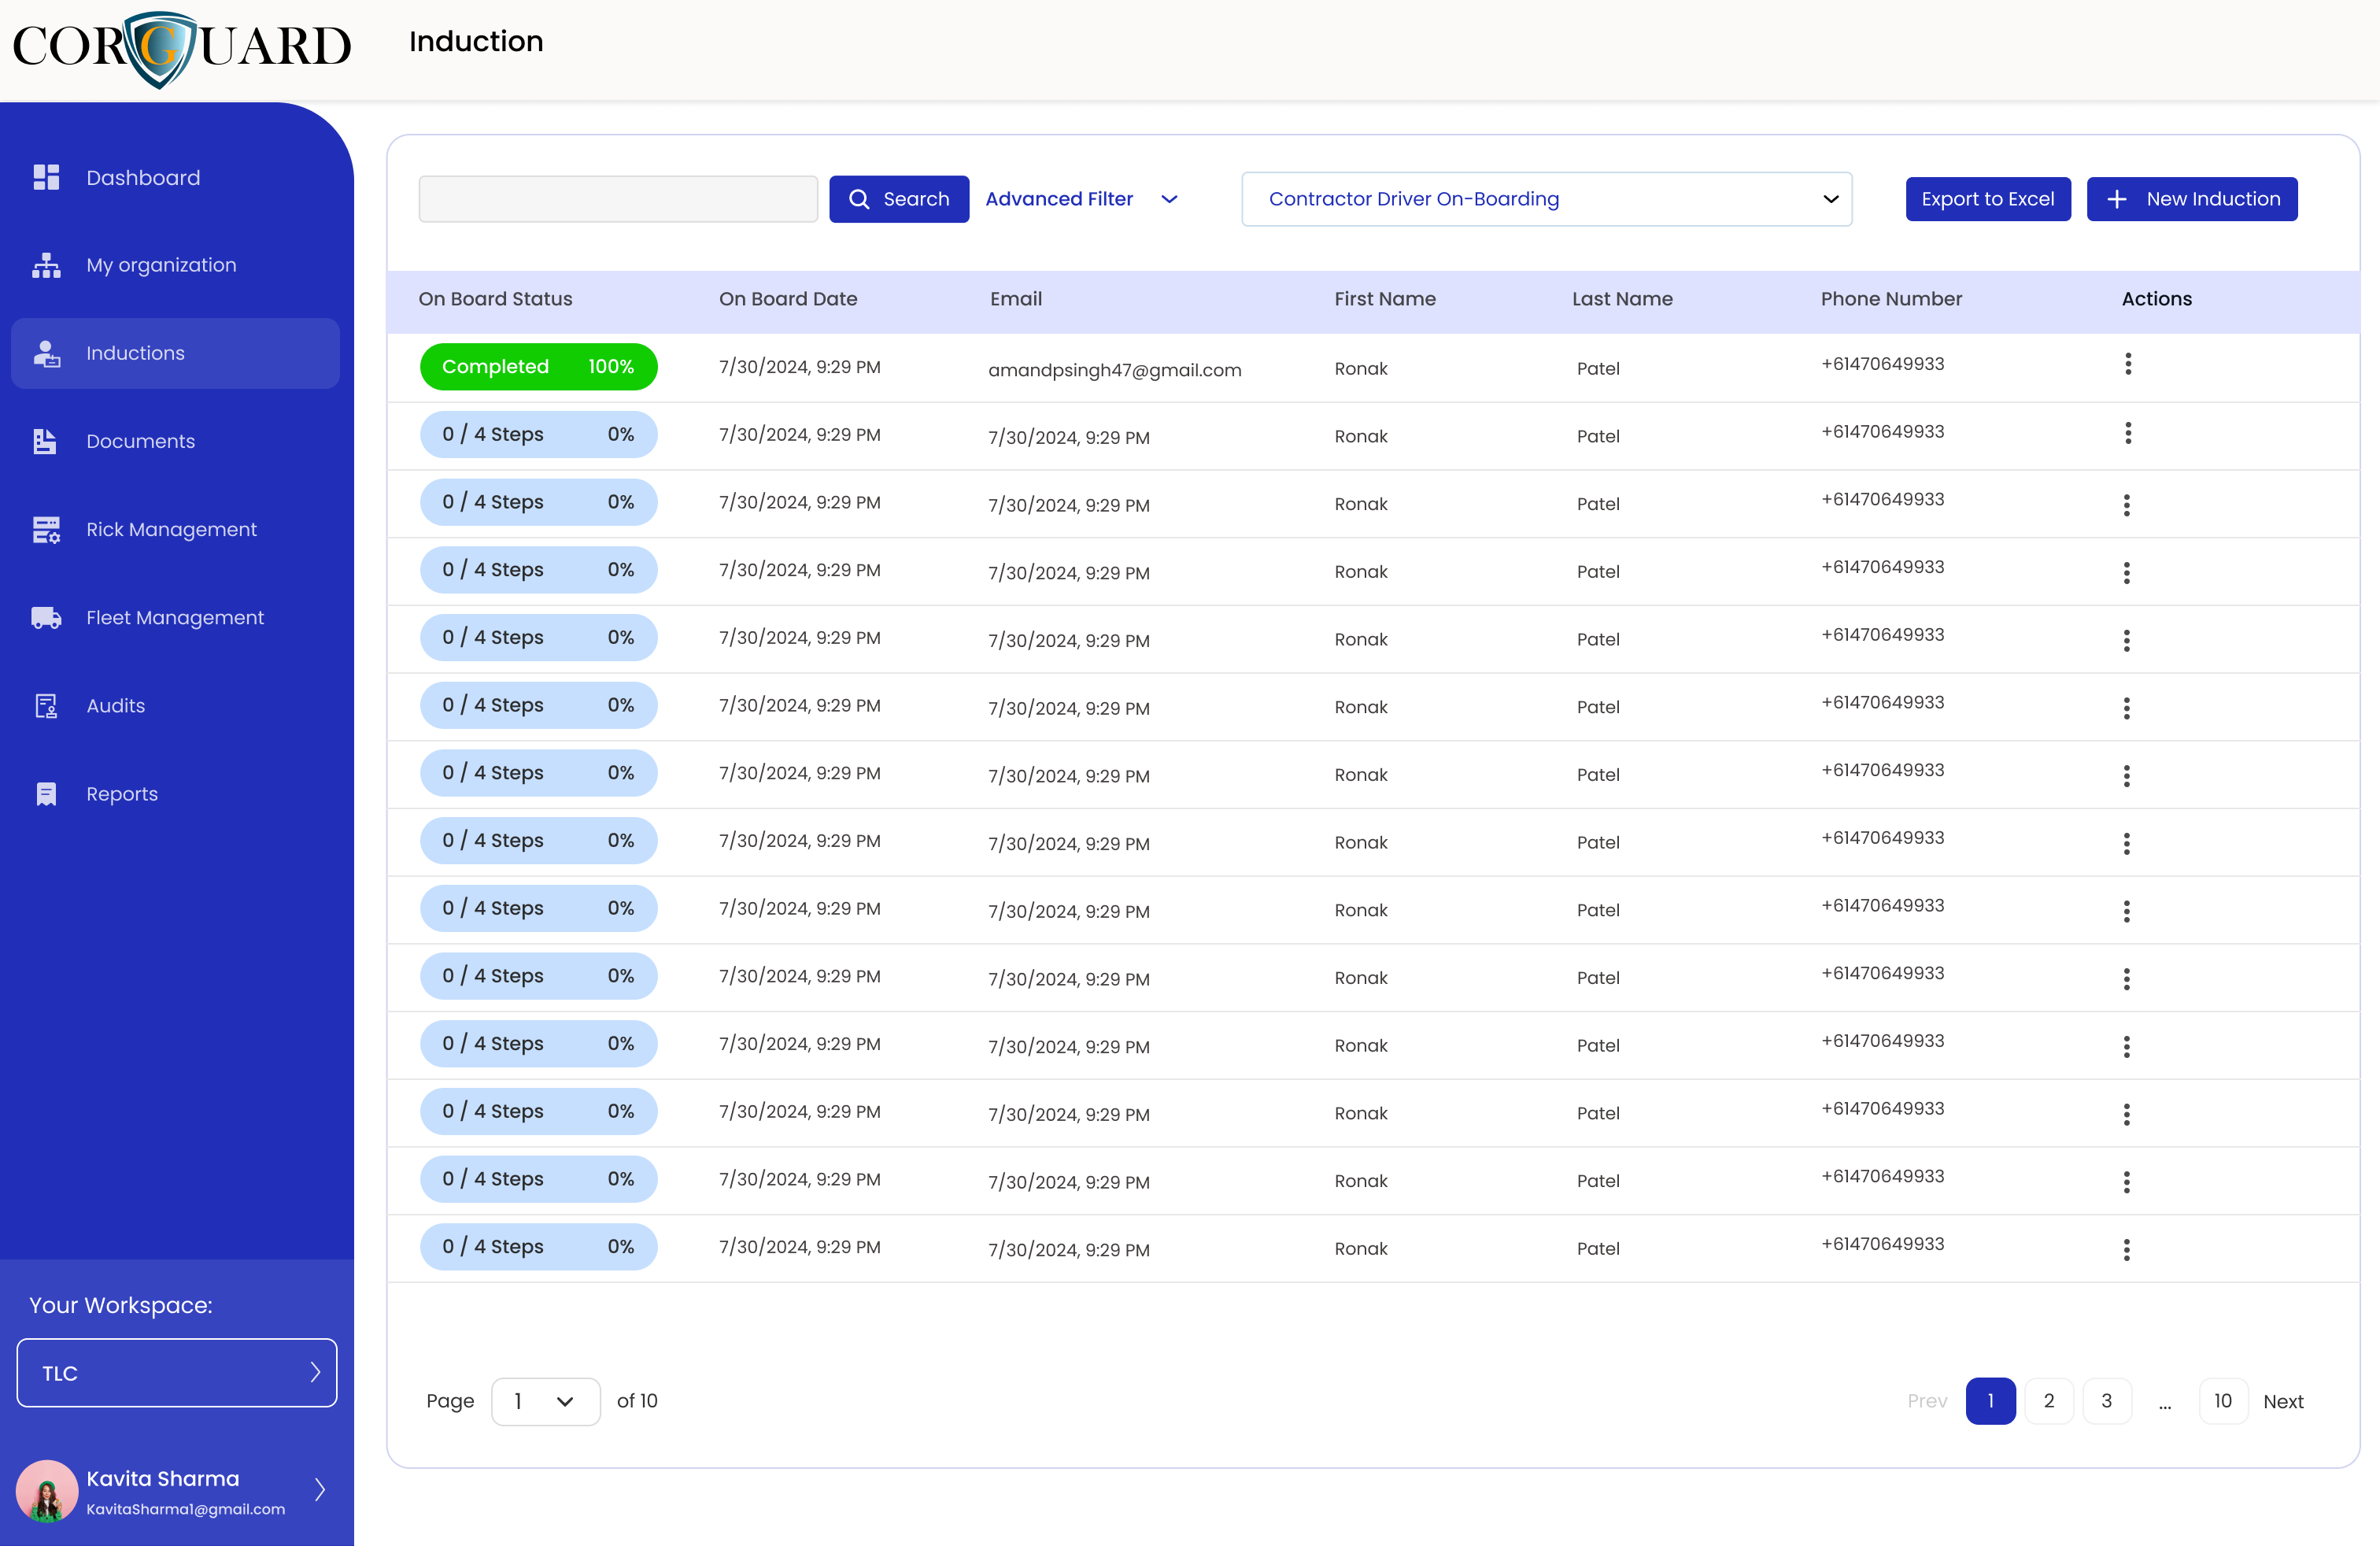
Advisory work should leave a practical implementation trail. These examples show how CoRGuard supports records, fatigue and driver diary checks, maintenance, audits, document control, inductions, corrective actions, and evidence review after MAEZ identifies the gaps.
Training records
Connect training completion from cortraining.com.au to evidence and follow-up.
Driver diary checks
Connect fatigue and driver diary review back to manager visibility.
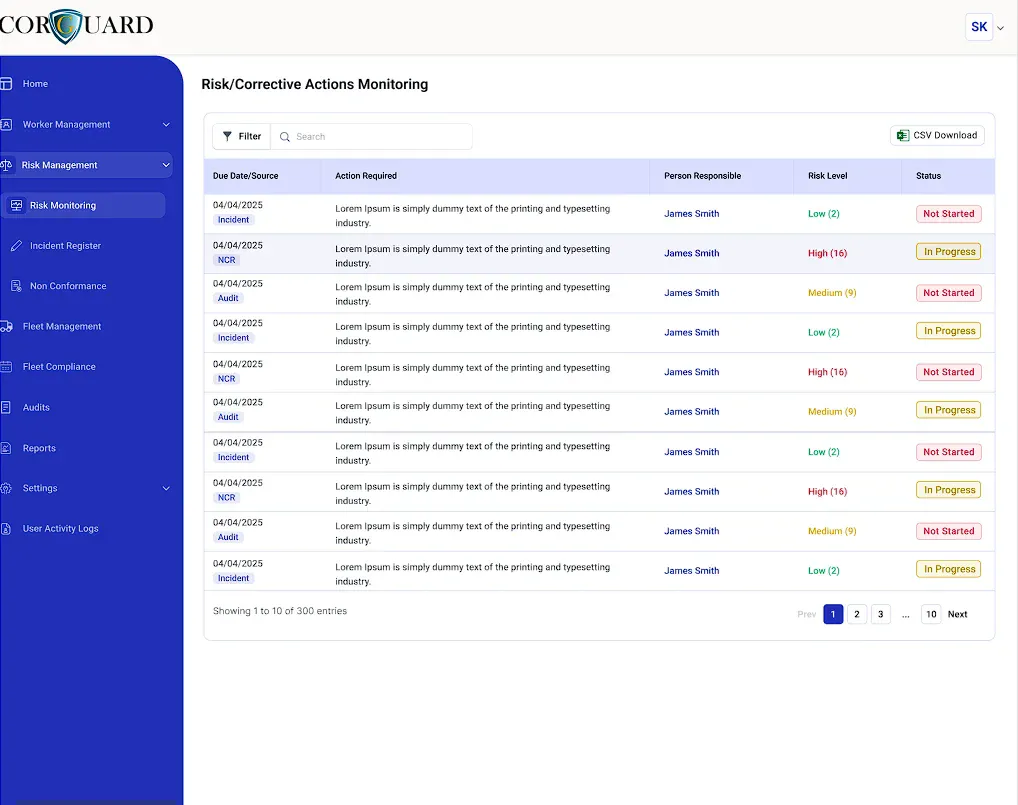
Corrective actions
Turn audit findings, hazards and incidents into tracked actions.
Keep exploring
Related Chain of Responsibility reading
MAEZ insight
Crafting an Effective Transport Safety Policy: A Guide
Learn how to develop transport safety policy with our comprehensive guide. Balance compliance and reality for a safer transportation framework.
MAEZ insight
Understanding the Heavy Vehicle National Law Explained
Explore the comprehensive heavy vehicle national law overview, unified safety standards, and the NHVR’s role in regulation across Australia.
MAEZ insight
Common Challenges in Safety Management Systems Explored
Explore common safety management system issues, from leadership visibility to data overload, and learn how to avoid these pitfalls for safer workplaces.
MAEZ insight
Top Safety Management System Best Practices Explained
Discover effective safety management system best practices to reduce risks and improve workplace safety. Learn how operational tools can transform safety.
MAEZ insight
Effective Strategies for Implementing COR Training
Discover how to implement COR training with effective strategies tailored to FAC-COR certification levels. Elevate your skills in contract management.
MAEZ insight
Essential Transport Safety Management Tips for 2024
Discover essential transport safety management tips for 2024, blending regulatory compliance with practical strategies for improved safety culture.
Frequently asked questions
Questions people ask about this topic
What are the seven common transport safety issues in Australia?
The seven common transport safety issues are driver fatigue, distracted driving, vehicle collisions, poor vehicle maintenance, weather-related hazards, cargo securement failures, and slips, trips, and falls in transport operations. Each rarely exists in isolation — they interact with scheduling pressure, workload design, and resourcing decisions.
How does driver fatigue compare to alcohol impairment?
After 17 hours awake, a driver's performance matches someone with a 0.05% blood alcohol concentration. After 24 hours awake, impairment equals 0.10% BAC. Micro-sleeps lasting 3–4 seconds can occur without warning, meaning a vehicle travels over 100 metres at highway speed with no driver control.
Why are hands-free devices not safe for heavy vehicle drivers?
Hands-free devices create a false sense of security because cognitive distraction persists during phone conversations. Drivers miss critical visual cues while mentally engaged in discussions, meaning their attention is diverted from the primary task of vehicle operation even though their eyes remain on the road.
How does vehicle maintenance connect to Chain of Responsibility duties?
Under the Heavy Vehicle National Law, operators and other parties in the transport chain have a primary duty to ensure the safety of transport activities. Vehicle standards and maintenance are a core part of meeting that duty, meaning maintenance records serve as compliance evidence that the duty is being fulfilled.
What following distance should heavy vehicles maintain to prevent rear-end collisions?
Heavy vehicles should maintain a minimum 4-second following gap, as the standard 2-second rule applies only to light vehicles in ideal conditions. Following distances must be adjusted for vehicle weight, speed, and road conditions to ensure adequate stopping capability.